Anychart
Advertisement
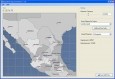
AnyChart Flash Map Converter v.1.0.4
Convert ESRI ShapeFiles (.SHP) geolocation data into AnyMap format to be used with AnyChart. AnyChart Flash Map Converter allows making use of a wide choice of maps with AnyChart, a GIS system that recognizes map data in AnyMap format only.
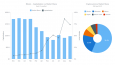
AnyChart JS Charts and Dashboards v.8.7.0
AnyChart is a flexible, cross-platform/browser, dependency-free JS chart library for adding interactive bar, area, pie, column, spline, scatter, line, gauge, treemap, funnel, sparkline, Mekko, Venn, other HTML5 charts/dashboards to any website/app.
Advertisement
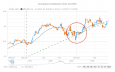
AnyChart Stock Chart Component v.1.0
AnyChart Stock and Financial Charts (short name:AnyStock) is an XML/JSON Flash based financial charting solution.
AnyChart Map Converter v.1.0.3261.26913
Visualize geolocation data in ESRI ShapeFiles format. AnyChart Map Converter utility is designed to convert ESRI ShapeFiles (*.shp) into the special AMAP format for using in the geo map module of AnyChart Flash Component - AnyMap.
AnyChart Stock and Financial Flash Chart v.1.1.0
AnyStock is a flexible Flash-based solution to create interactive and attractive stock and financial charts with large datasets support and great scrolling options. XML/JSON interface, technical indicators and drawings, full localization support.

AnyMap JS Maps v.8.7.0
AnyMap JS Maps is an advanced JavaScript-HTML5 mapping library with the ever-expanding Map Collection, which makes you able to easily create interactive maps looking great on PCs, Macs, iPhones, iPads, Androids and other devices. Highly customizable.

GraphicsJS v.1.2.0
GraphicsJS is a free, open-source JavaScript library for easily drawing any interactive HTML5 graphics and animation. It's lightweight and supports powerful line drawing (curves, arcs...), multiline texts, virtual DOM, smart layering, convenient API.
AnyStock Stock and Financial JS Charts v.8.7.0
AnyStock Stock and Financial JS Charts is a flexible JavaScript charting library to visualizing large data sets in interactive HTML5 charts. Designed to display date/time information it offers various chart types, drawing tools, technical indicators.
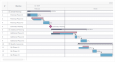
AnyGantt JS Gantt Charts v.8.7.0
AnyGantt is a flexible, cross-platform and cross-browser JavaScript charting library that allows you to easily build smart HTML5 Gantt Charts and utilize the power of animation and ultimate interactivity to facilitate project and resource management.